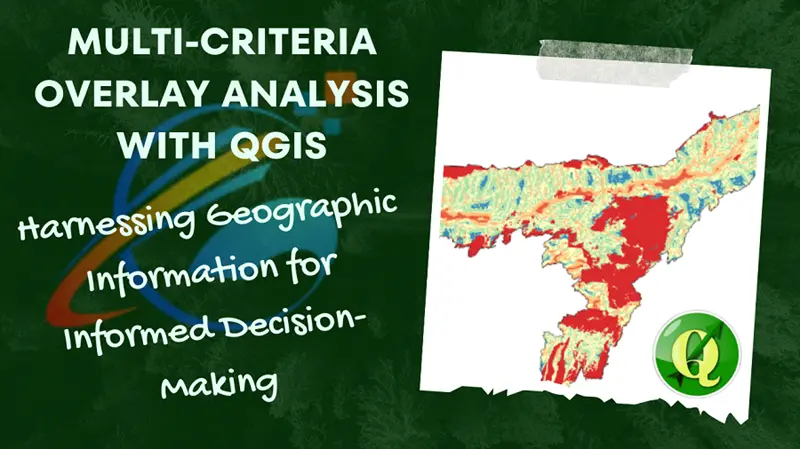
In today's interconnected world, data-driven decision-making has become paramount across various industries. One powerful tool in this realm is Geographic Information Systems (GIS), which enables the integration of spatial data to extract insights and support well-informed choices. Multi-criteria overlay Analysis (MCOA) is a GIS technique that empowers decision-makers to evaluate multiple factors simultaneously, aiding in the identification of optimal locations, resource allocation, and more. Quantum GIS (QGIS), an open-source GIS software, plays a pivotal role in democratizing such spatial analysis capabilities.
Understanding Multi-Criteria Overlay Analysis (MCOA)
In the realm of Geographic Information Systems (GIS), decision-making frequently involves navigating complex spatial relationships influenced by a multitude of factors. Multi-criteria overlay Analysis (MCOA) is a sophisticated technique that addresses this complexity by allowing decision-makers to evaluate and synthesize multiple layers of geographic information simultaneously. This method holds the power to transform disparate data into actionable insights, facilitating optimal choices in various domains such as urban planning, environmental management, and infrastructure development.
At its core, MCOA revolves around the concept of overlaying several spatial datasets to create a composite map that highlights areas aligning with specific criteria. This approach shines brightest when decisions hinge on a convergence of factors, each carrying its own spatial significance. For instance, envision the challenge of selecting an optimal location for a new retail store. In this scenario, the decision cannot be solely based on any single criterion; instead, it must consider a multitude of variables.
Considerations in Real-World Applications:
Take the retail store example: When determining a suitable site, factors like proximity to potential customers, ease of access, and competition dynamics all play a pivotal role. Each of these elements holds a geographical dimension that contributes to the overall decision-making process. MCOA steps in to harmonize these diverse factors, allowing for a comprehensive evaluation that transcends individual layers of data.
The proximity to customers is essential for ensuring foot traffic and visibility. This could involve mapping population density, analyzing demographic data, and understanding consumer behavior patterns. Meanwhile, assessing accessibility might require factoring in transportation networks, public transit availability, and road infrastructure conditions.
Equally important is the consideration of competition. MCOA allows decision-makers to map existing retail outlets, analyze their market share, and even predict potential customer flows based on spatial dynamics. Such a comprehensive approach empowers stakeholders to strategically position their new store in a way that capitalizes on gaps in the market while minimizing the threat posed by competitors.
MCOA in Action:
Implementing MCOA involves a structured workflow. After collating the necessary data layers – whether they are spatial polygons delineating customer catchment areas, road networks, population distributions, or competitor locations – the data undergoes a series of transformations to render them compatible. This might involve standardizing units, scales, and formats to ensure a fair comparison across criteria.
Next comes the process of weighting criteria. Decision-makers assign relative weights to each criterion, signifying their respective importance. These weights can reflect expert opinions or stakeholder preferences, imbuing a degree of subjectivity that captures the nuanced priorities of the decision at hand.
Normalization follows, ensuring that each criterion is scaled to a common range. This step guards against a single criterion disproportionately influencing the outcome due to variations in scale.
Overlay analysis, facilitated by QGIS, integrates these normalized criteria into a composite map. Various methods – such as Weighted Sum or Analytical Hierarchy Process – calculate composite scores for different geographic units, which are then classified and visualized to reveal zones meeting the desired criteria most effectively.
In essence, MCOA transforms complex, multidimensional data into a coherent and actionable format. By marrying geographic elements with a multitude of criteria, this technique empowers decision-makers to navigate the intricate web of factors that define modern challenges. As QGIS continues to provide a user-friendly and accessible platform for MCOA, its potential to revolutionize decision-making across industries grows ever more evident.
Key Steps in Multi-Criteria Overlay Analysis:
- Data Collection and Preparation:
Absolutely, let's delve deeper into the crucial step of Data Collection and Preparation in Multi-Criteria Overlay Analysis (MCOA) using QGIS.
Data Collection:
Collecting relevant and accurate data is the foundation of any successful GIS analysis. In the context of MCOA, data collection involves acquiring spatial data layers that correspond to the criteria being considered. These layers can include:
- Vector Data:
- Points: These represent specific geographic locations, such as landmarks, addresses, or sampling sites. In the context of site selection, they could be potential store locations or project sites.
- Lines: These represent linear features like roads, rivers, or pipelines. They play a crucial role in assessing accessibility and connectivity.
- Polygons: These represent areas with defined boundaries, like administrative zones, land use types, or zoning districts. They help in understanding spatial relationships and constraints.
- Raster Data:
- Satellite Imagery: High-resolution satellite images provide a visual representation of the landscape, enabling analysis of land cover, vegetation, and built-up areas.
- Elevation Data: Digital Elevation Models (DEMs) provide information about the terrain's elevation, slope, and aspect, which are essential for various analyses, such as flood risk assessment or viewshed analysis.
- Climate Data: Raster data representing climatic variables like temperature, precipitation, or wind speed can be vital for environmental impact assessments.
Data Preparation:
Once the data is collected, it needs to be prepared for analysis. This involves several key steps:
- Data Conversion and Formatting:
- Data might be collected in various formats, such as shapefiles, GeoTIFFs, or CSV files. QGIS supports these formats and allows you to convert them as needed.
- Ensure that the coordinate reference systems (CRS) of all data layers are consistent. QGIS provides tools for reprojecting data to a common CRS, which is crucial for accurate spatial analysis.
- Data Cleaning and Quality Assurance:
- Inspect the data for errors, gaps, or inconsistencies. For instance, check for missing values, duplicate records, or topological errors in vector data.
- Address any data quality issues through cleaning processes like removing outliers or interpolating missing values.
- Attribute Management:
- Assign meaningful attributes to each layer's features. These attributes are used as criteria in the overlay analysis. For example, a retail store site selection might require attributes like population density, distance to competitors, and transportation access.
- Data Integration:
- Integrate various layers into a single project in QGIS. This provides the spatial context needed for overlay analysis.
- Ensure that attribute tables align with the spatial features. QGIS allows you to join tables based on common attributes.
- Normalization:
- Different criteria layers might have varying scales. Normalize the data to ensure that no single criterion disproportionately influences the analysis due to its magnitude. Common normalization methods include Min-Max Scaling or Z-Score Normalization.
In essence, the success of any MCOA heavily relies on the accuracy, quality, and compatibility of the collected spatial data. Effective data collection and thorough preparation in QGIS set the stage for a robust and insightful multi-criteria analysis that aids in making informed decisions based on a holistic understanding of the geographical factors at play.
2. Weighting Criteria:
In the realm of Multi-Criteria Overlay Analysis (MCOA), the process of assigning weights to criteria plays a pivotal role in ensuring that the final results accurately reflect the decision-maker's priorities. Not all criteria are equally important, and some may carry more weight in influencing the final outcome. This step introduces a layer of subjectivity, as it involves decision-makers judgments and domain expertise. Quantum GIS (QGIS) excels in facilitating this crucial step, providing a user-friendly platform for customizing analysis through criteria weighting.
Understanding Criteria Weighting:
In any decision-making scenario, various factors or criteria contribute to the overall assessment. These criteria can be diverse, ranging from socio-economic factors, environmental considerations, infrastructure availability, population density, and more. However, these criteria rarely possess the same level of significance. For instance, when selecting a location for a new healthcare facility, factors like proximity to a hospital might carry more weight than the availability of parking spaces.
The Role of Weights:
Weights assign a numerical value to each criterion, indicating its relative importance in the decision-making process. Decision-makers usually assign these weights based on their expertise and a thorough understanding of the problem at hand. Weights can be represented as percentages, decimals, or even integers, depending on the analysis method and personal preferences.
Subjectivity and Customizability:
One of the strengths of QGIS lies in its ability to accommodate subjective opinions and expert insights during the analysis. Since criteria weighting involves a degree of subjectivity, QGIS enables decision-makers to define these weights in a flexible manner. This customization is crucial for generating accurate and meaningful results that align with real-world priorities.
Implementing Criteria Weighting in QGIS:
QGIS offers various tools and methods for incorporating criteria weighting into MCOA. Here's a general outline of how this process is accomplished:
Data Preparation: Assemble the necessary spatial data layers for the analysis. These could include socioeconomic data, environmental data, infrastructure data, and more.
Defining Criteria: Identify the criteria that will contribute to the decision-making process. Each criterion should be a separate layer, providing information relevant to the analysis.
Assigning Weights: QGIS provides interfaces or plugins that allow users to assign weights to each criterion. These interfaces usually require the user to input the weights manually or through a scale, such as a 1-10 ranking.
Normalization: After weights are assigned, the criteria may be normalized to bring them to a common scale. This step ensures that criteria with larger values do not dominate the analysis solely due to their scale.
Overlay Analysis: Once the weights and normalization are in place, QGIS conducts the overlay analysis, combining the criteria layers into a composite map that reflects the weighted contributions.
Results Visualization: The composite map's results can be visualized using QGIS's mapping and visualization tools, often represented through color gradients or thematic maps.
3. Normalization: Ensuring Balanced Contributions of Criteria
Normalization is a pivotal step in the Multi-Criteria Overlay Analysis (MCOA) process within QGIS. It addresses a common challenge in spatial analysis: dealing with criteria that have varying units, scales, or magnitudes. Without proper normalization, criteria with larger values could dominate the analysis simply due to their scale, overshadowing other important criteria. Here's an in-depth look at the normalization process and its significance:
Understanding the Challenge:
Imagine you are evaluating potential sites for a new hospital. Your criteria include factors like population density, proximity to major roads, and availability of public transportation. Population density might range from a few hundred to several thousand people per square kilometer, while distances to roads and transportation might span from a few meters to a few kilometers. Directly overlaying these criteria without normalization could result in misleading conclusions. The distance-based criteria would naturally have smaller values and might be overshadowed by the larger population density values.
Normalization Techniques:
Normalization involves transforming the criteria values into a common scale, typically ranging from 0 to 1. This allows different criteria to be compared fairly and equally. QGIS provides several normalization techniques:
Min-Max Normalization: This method scales values to fit within the [0, 1] range. The formula is: normalized_value = (original_value - min_value) / (max_value - min_value). It maintains the relative differences between values but compresses them into the 0-1 range.
Z-Score (Standard Score) Normalization: Z-score transformation standardizes values to have a mean of 0 and a standard deviation of 1. This method is suitable when data distribution is important. The formula is: normalized_value = (original_value - mean) / standard_deviation.
Vector Normalization: Here, criteria values are transformed into vectors with a common length. This technique is useful when you want to maintain the direction of data relationships, such as when the direction of higher values indicates better suitability.
Significance of Normalization:
Normalization ensures that no single criterion dominates the analysis due to its scale. It prevents the erroneous prioritization of criteria solely based on their magnitude. By bringing all criteria to a common scale, normalization allows decision-makers to genuinely weigh the importance of different factors in their decision process. This is especially crucial in cases where criteria have inherently different measurement units.
QGIS's Role in Normalization:
QGIS offers a suite of tools and plugins to facilitate normalization during the MCOA process. These tools often require minimal input from users, making the normalization process efficient and accurate. QGIS's user-friendly interface empowers users, even those without extensive GIS expertise, to employ normalization techniques effectively.
4. Overlay Analysis:
Overlay Analysis is the heart of the Multi-Criteria Overlay Analysis process. It involves combining and synthesizing multiple layers of spatial information to generate a comprehensive output that highlights areas meeting specific criteria. QGIS, being a versatile Geographic Information System software, provides various techniques for conducting this analysis, each catering to different decision-making scenarios. Here are three prominent methods used within QGIS for Overlay Analysis in MCOA:
- Weighted Sum: The Weighted Sum method is one of the simplest ways to perform Overlay Analysis in QGIS. It involves multiplying each criterion's normalized value by its assigned weight and summing up these weighted values to obtain a composite score for each location. This technique is effective when criteria are relatively independent of each other and can be directly added together.
- Weighted Linear Combination: Similar to the Weighted Sum method, the Weighted Linear Combination technique takes into account the normalized values and assigned weights for each criterion. However, it offers more flexibility by allowing the introduction of linear relationships between criteria. This is particularly useful when certain criteria need to be prioritized over others based on specific conditions.
- Analytical Hierarchy Process (AHP): The Analytical Hierarchy Process is a more advanced method available in QGIS for Overlay Analysis. It involves creating pairwise comparisons between criteria to derive their relative importance. These comparisons are turned into numerical values that are used to calculate the weighted sum for each location. AHP is beneficial when there are complex interactions and dependencies among criteria, and when decision-makers require a more robust method of deriving weights.
Performing Overlay Analysis in QGIS:
Performing Overlay Analysis using these techniques in QGIS involves a series of steps:
- Layer Stacking: Load the relevant layers into QGIS, each representing a different criterion. Ensure that these layers are properly georeferenced and have matching coordinate systems.
- Normalization: Normalize each criterion layer to standardize the values. Common normalization methods include Min-Max scaling, Z-score normalization, or using fuzzy logic to capture more nuanced relationships.
- Assigning Weights: Assign weights to each criterion layer based on its relative importance in the decision-making process. QGIS provides tools to input these weights.
- Overlay Analysis Method Selection: Choose the appropriate Overlay Analysis method based on the nature of your data and the decision-making context.
- Composite Map Generation: Utilize QGIS tools to perform the chosen Overlay Analysis technique. This will generate a composite map where each location's suitability or desirability is represented by a composite score.
- Classification and Visualization: Classify the composite scores into categories or classes to better understand the results. QGIS allows you to apply color schemes, symbology, and legends for effective visualization.
- Validation and Sensitivity Analysis: Validate the results by comparing them with real-world observations or expert knowledge. Conduct sensitivity analysis by altering criteria weights or values to gauge the robustness of your conclusions.
5. Classification and Visualization:
In the realm of Multi-Criteria Overlay Analysis (MCOA), the culmination of data integration, weighting, normalization, and overlay analysis results in a composite map that represents a comprehensive spatial overview. However, the value of this map is fully realized through effective classification and visualization techniques. Quantum GIS (QGIS) plays a pivotal role in transforming raw data into insightful, easily interpretable maps that drive informed decision-making.
Classifying the Composite Map:
Once the composite map is generated by combining various layers with their respective weights and scores, it often contains continuous values representing the integrated criteria. However, to simplify interpretation, these values need to be categorized into distinct classes or ranks. This process is called classification and involves breaking down the range of values into intervals or bins. The choice of classification method depends on the data's distribution, the number of classes desired, and the goal of the analysis.
QGIS provides various classification methods, including:
- Equal Interval: Divides the range of values into equal intervals. Suitable when data distribution is fairly uniform.
- Natural Breaks (Jenks): Optimally groups values to minimize variation within classes and maximize variation between classes.
- Quantile: Divides data into classes with an equal number of data points in each class, helpful for capturing the spread of data.
- Standard Deviation: Based on the standard deviation of the data, this method groups values around the mean.
- Custom Breaks: Allows users to manually define class breaks based on domain knowledge or specific requirements.
Visualizing the Results:
Once the composite map is categorized, the next step is to effectively visualize it. QGIS offers a rich set of visualization tools to make the map more understandable and informative:
- Color Ramps: QGIS provides a wide range of color ramps that allow users to assign distinct colors to different classes. This helps in quickly differentiating between areas with varying characteristics.
- Symbology: Users can customize the appearance of map features using various symbols and styles. For instance, they can assign different shapes or sizes to different classes for more nuanced visualization.
- Labels and Legends: Legends provide a key to understanding the map, showing the correspondence between colors and classes. Users can also label map features with relevant information, enhancing clarity.
- Opacity and Transparencies: QGIS allows users to adjust the transparency of map layers, enabling better visualization when overlapping layers are present.
- 3D Visualization: For an even deeper understanding, QGIS supports 3D visualization, which adds an extra dimension to the analysis, aiding in the visualization of terrain, elevation, and spatial relationships.
Enhancing Interpretation:
Effective classification and visualization techniques play a crucial role in translating complex numerical data into actionable insights. By transforming the composite map into an easily understandable visual representation, decision-makers can quickly grasp spatial patterns, trends, and relationships. Whether it's identifying hotspots of suitability for new development, assessing vulnerability in disaster-prone areas, or locating optimal resource allocation zones, QGIS equips users with the tools to present data in a way that resonates and informs.
6. Validation and Sensitivity Analysis:
In the realm of spatial analysis, the ability to validate the results and assess their sensitivity to different inputs is a critical aspect of making informed decisions. This step, often overlooked, adds an extra layer of reliability to the Multi-Criteria Overlay Analysis (MCOA) process conducted with Quantum GIS (QGIS). Validation and sensitivity analysis plays an indispensable role in ensuring that the conclusions drawn from the analysis accurately represent the real-world scenario and can withstand changes in the criteria or weights applied.
Validation: Ensuring Accuracy and Reliability
Validation of MCOA results in QGIS involves comparing the derived composite map with ground truth data or expert knowledge. This step helps assess whether the output aligns with known conditions, ensuring that the analysis has captured the actual spatial relationships and interactions between criteria. Some common validation techniques include:
- Field Verification: Actual field visits or ground truth data collection can verify whether the areas designated as suitable by the composite map match real-world conditions. This on-ground verification enhances the credibility of the analysis.
- Historical Data Comparison: If available, historical data can be compared with the analysis results to validate whether the areas predicted as optimal align with past trends or occurrences.
- Expert Review: Engaging domain experts to review the analysis methodology and results provides valuable insights and can help identify any potential errors or discrepancies.
- Cross-Validation: Dividing the data into subsets and validating the analysis on one subset using the other can help assess the model's performance and generalizability.
Sensitivity Analysis: Understanding the Impact of Changes
Sensitivity analysis involves testing the robustness of the MCOA results by altering the weights assigned to criteria or modifying the criteria themselves. QGIS's flexible interface allows users to easily adjust these parameters and observe how such changes impact the final composite map. This step serves several purposes:
- Identifying Critical Criteria: Sensitivity analysis helps identify which criteria or weights have the most significant impact on the analysis outcome. This insight is invaluable in refining the decision-making process.
- Scenario Exploration: Decision-makers can explore different scenarios by adjusting weights and criteria. For example, in site selection, one can assess how different weightings influence the ranking of potential locations.
- Risk Assessment: Sensitivity analysis aids in understanding the stability of decisions under varying conditions. By identifying areas where slight changes in criteria can lead to drastically different outcomes, decision-makers can mitigate potential risks.
- Transparency and Communication: Demonstrating the results of sensitivity analysis adds transparency to the decision-making process. It showcases that decisions are not solely dependent on the analysis but are also guided by an understanding of how different factors interact.
Iterative Process: Enhancing Reliability
Validation and sensitivity analysis are iterative processes that interact closely. As the analysis is refined, validation helps ensure that adjustments are leading to more accurate results. Similarly, sensitivity analysis guides the refinement process, as insights gained from testing different scenarios inform the final weights and criteria chosen.
Advantages of MCOA with QGIS
- Cost-Efficient:
In an era where technology plays an ever-expanding role in decision-making processes, the financial implications of software solutions cannot be overlooked. In the realm of Geographic Information Systems (GIS), proprietary software licenses have often posed a barrier to entry for individuals, small businesses, non-profit organizations, and resource-constrained regions. However, Quantum GIS (QGIS) has emerged as a game-changer, offering a cost-efficient and accessible platform for Multi-Criteria Overlay Analysis (MCOA) and other GIS tasks.
Breaking Down the Cost Barrier:
Traditional GIS software solutions often come with substantial costs, including initial purchase expenses, ongoing subscription fees, and charges for updates and support. These expenses can be prohibitive, particularly for smaller organizations or grassroots initiatives. QGIS, on the other hand, is an open-source software, which means that it is freely available for download and use. This immediately removes the financial obstacle that often accompanies proprietary GIS software.
Accessibility for All:
The open-source nature of QGIS has far-reaching implications for the accessibility of spatial analysis capabilities. It levels the playing field by granting access to advanced GIS functionalities to a broader spectrum of users. This inclusivity extends to:
Educational Institutions: QGIS serves as an invaluable educational tool, allowing students to gain hands-on experience with GIS technology without the financial burden. This prepares the next generation of professionals with the skills needed to harness geographic information effectively.
Non-Profit Organizations: Many non-profits operate with limited budgets dedicated to software expenses. QGIS empowers these organizations to conduct sophisticated spatial analyses that might otherwise have been financially unfeasible.
Developing Regions: In regions with limited resources, the cost of proprietary software licenses can be a significant barrier to adopting GIS technology. QGIS's cost-efficiency facilitates the utilization of GIS for development projects, disaster management, and environmental initiatives in these areas.
Citizen Science Initiatives: QGIS enables citizen scientists, community activists, and grassroots organizations to engage with GIS data, fostering a deeper understanding of local geographical issues and facilitating evidence-based advocacy.
Community-Driven Development:
QGIS's open-source nature has led to the formation of a vibrant global community of users, developers, and contributors. This collaborative ecosystem ensures continuous improvements, updates, and the development of new features. This community-driven development not only enhances the software's capabilities but also cultivates a sense of shared ownership and knowledge exchange.
Training and Support:
While proprietary software often comes with premium-priced support packages, QGIS users benefit from an extensive network of community forums, online tutorials, and documentation. This democratization of knowledge means that users can access guidance, troubleshoot issues, and learn from one another without incurring additional expenses.
2. Customizability:
In the realm of Geographic Information Systems (GIS), customization plays a pivotal role in empowering users to extract the maximum value from their spatial data. When it comes to Multi-Criteria Overlay Analysis (MCOA), the customizability offered by Quantum GIS (QGIS) becomes a game-changer, enabling analysts and decision-makers to fine-tune the analysis to their specific requirements. Let's delve deeper into how QGIS's customization options enhance the MCOA process:
Extensive Plugin Ecosystem: QGIS boasts an extensive ecosystem of plugins that enhance its functionality. These plugins are essentially add-on tools that can be easily integrated into the QGIS environment. For MCOA, this means that users can access specialized plugins that align with their analytical goals. Whether it's a plugin for advanced raster calculations, data interpolation, or specialized algorithms, QGIS's plugin repository has it all. This allows users to extend QGIS's core capabilities and craft an analysis process that precisely fits their needs.
Flexible Data Integration: Customizability in MCOA starts with the ability to seamlessly integrate various data formats and sources. QGIS supports an array of data formats, including vector (e.g., shapefiles, GeoJSON) and raster (e.g., TIFF, JPEG) formats. This flexibility means that users can bring in diverse datasets, ranging from satellite imagery and elevation data to socio-economic data and transportation networks. With customizable symbology and labeling options, users can visually represent these different datasets effectively within their analyses.
Advanced Analysis Tools: MCOA can involve complex computations and algorithms, especially when considering multiple criteria and their weighted combinations. QGIS caters to this complexity by offering advanced analysis tools such as the Processing Toolbox. This toolbox hosts a wide variety of algorithms for geoprocessing, spatial analysis, and modeling. From spatial statistics to terrain analysis, users can cherry-pick the tools that align with their MCOA objectives. Furthermore, the graphical modeler allows users to construct complex workflows visually, making the customization of analysis processes intuitive and user-friendly.
Custom Expression Functions: QGIS's expression engine allows users to create custom expressions to manipulate and analyze data. This level of customization is particularly valuable in MCOA, where combining, transforming, or filtering data might be necessary. Users can create their own mathematical functions, conditional statements, and calculations to cater to the unique demands of their analysis. This empowers users to address specific spatial challenges and incorporate domain-specific knowledge seamlessly.
Interactive Visualizations: Customizability also extends to the visual representation of results. QGIS provides a wide range of symbology options, color ramps, and labeling styles, enabling users to design visually appealing and informative maps that convey the results of their MCOA effectively. Custom legends, labels, and dynamic map compositions can be crafted to highlight areas of interest or influence within the analysis.
3. Interdisciplinary Applications:
Multi-criteria overlay Analysis (MCOA) in conjunction with Quantum GIS (QGIS) is a versatile technique that transcends disciplinary boundaries, offering invaluable insights and solutions to a wide array of sectors. The ability to integrate and analyze multiple geographic factors simultaneously makes MCOA a game-changer in the following interdisciplinary applications:
Urban Planning and Development:
Urban planners grapple with complex decisions involving land use, infrastructure, and public services. MCOA enables them to weigh factors like accessibility, land value, transportation networks, and environmental impact, assisting in optimal zoning, determining suitable locations for public facilities, and promoting sustainable urban growth.
Environmental Management:
MCOA is a powerful tool for environmental analysis. It aids in identifying ecologically sensitive areas, prioritizing conservation efforts, and planning for sustainable resource management. By overlaying factors like soil type, vegetation, water bodies, and terrain, QGIS allows environmental experts to target areas for habitat restoration, erosion control, or reforestation.
Site Selection and Land Management:
Industries such as retail, energy, and agriculture benefit from MCOA when selecting new sites. For instance, renewable energy projects require a blend of solar exposure, wind speed, and topography. Using QGIS, developers can assess potential sites comprehensively, maximizing efficiency while minimizing environmental impact.
Disaster Management and Risk Assessment:
MCOA plays a pivotal role in disaster preparedness and risk assessment. By combining factors like population density, infrastructure vulnerability, terrain characteristics, and proximity to hazards, emergency response teams can identify high-risk areas and allocate resources effectively. This approach aids in evacuation planning, resource distribution, and post-disaster recovery.
Transportation Planning:
Transportation networks are intricate systems influenced by various factors. MCOA assists in optimizing transportation planning by considering factors such as traffic flow, road conditions, public transit accessibility, and population density. This leads to well-designed road networks and efficient public transportation systems.
Agricultural and Natural Resource Management:
Agriculture relies on a multitude of factors, from soil quality and precipitation patterns to market proximity. MCOA helps in selecting suitable areas for specific crops, optimizing water resource allocation, and identifying prime locations for sustainable farming practices.
Healthcare Facility Location Analysis:
In healthcare planning, MCOA aids in determining optimal locations for medical facilities. Factors such as demographic distribution, travel times, and accessibility are weighed to ensure healthcare services are conveniently accessible to the population.
Tourism and Recreation Planning:
The tourism industry benefits from MCOA by selecting sites for recreational facilities, hotels, and attractions. By overlaying factors like scenic beauty, cultural heritage, and transportation access, QGIS assists in creating memorable tourist experiences while preserving natural and cultural assets.
Natural Hazard Assessment:
Geologists and seismologists utilize MCOA to assess areas prone to natural hazards such as earthquakes, landslides, and tsunamis. The integration of geological, seismic, and topographic data helps predict potential hazard zones.
Infrastructure Development:
When planning new infrastructure projects like bridges, highways, and pipelines, MCOA aids in assessing factors like terrain suitability, environmental impact, and cost-effectiveness.
4. Informed Decision-Making:
In today's rapidly evolving world, decisions that impact communities, economies, and the environment require a comprehensive understanding of the intricate relationships between various factors. Traditional decision-making often focuses on a single criterion, leading to suboptimal outcomes that fail to account for the complex interactions within a geographic context. This is where Multi-Criteria Overlay Analysis (MCOA) steps in as a game-changer.
Understanding Complex Interactions:
Geographic contexts are multifaceted landscapes characterized by an array of interdependent factors. For instance, selecting a site for a new hospital involves considerations such as accessibility, population density, proximity to existing medical facilities, and local infrastructure. Ignoring any one of these factors could lead to a suboptimal decision.
MCOA enables decision-makers to transcend the limitations of single-factor analysis by integrating multiple criteria into a unified framework. By overlaying and synthesizing layers of data, QGIS empowers decision-makers to visualize the interplay between these criteria, providing a holistic perspective that mirrors the intricacies of the real world.
Balancing Trade-offs and Synergies:
In many scenarios, decision-makers face trade-offs between conflicting criteria. For example, when planning a new residential development, there might be a trade-off between minimizing environmental impact and maximizing accessibility. MCOA in QGIS allows decision-makers to assign weights to criteria based on their priorities, highlighting areas where the balance of factors aligns with their goals.
Moreover, MCOA unveils synergies that might otherwise go unnoticed. Certain locations might excel in multiple criteria simultaneously, offering the potential for win-win situations. By leveraging QGIS's analysis capabilities, decision-makers can identify these opportunities and optimize their choices accordingly.
Risk Assessment and Resilience:
In contexts involving risk assessment and disaster management, considering multiple criteria is paramount. For instance, when identifying suitable areas for building critical infrastructure like power plants or reservoirs, decision-makers must weigh factors such as flood risk, geological stability, and population density. MCOA empowers them to assess vulnerability and build resilience by identifying areas that meet safety and functionality criteria simultaneously.
Community Engagement:
Transparent decision-making is vital for garnering public support and trust. MCOA, driven by QGIS, provides a visual representation of how decisions are reached. This empowers decision-makers to communicate the rationale behind their choices to stakeholders, fostering greater engagement and understanding.
Adapting to Changing Conditions:
The world is dynamic, and factors influencing decisions can change over time. MCOA's flexibility, coupled with QGIS's customizable tools, enables decision-makers to easily adapt their analyses to evolving circumstances. Whether it's urban expansion, changing demographics, or emerging environmental concerns, MCOA allows decision-makers to continuously reassess and adjust their choices.
5. Community Support:
In the realm of Geographic Information Systems (GIS), the strength of software not only lies in its technical capabilities but also in the support and collaborative ecosystem it offers. Quantum GIS (QGIS) shines in this aspect, boasting a vibrant user community that significantly enriches the software's functionality and accessibility.
A Collaborative Ecosystem:
One of the cornerstones of QGIS's success is its thriving user community, which spans the globe. This community comprises GIS enthusiasts, professionals, developers, educators, and researchers, all united by their shared interest in harnessing spatial data for various applications. This collaborative ecosystem brings numerous benefits to users at all levels of expertise:
1. Extensive Documentation and Tutorials:
QGIS's community-driven documentation serves as a comprehensive resource hub. Users can find detailed guides, tutorials, and manuals covering a wide range of topics. Whether you're a beginner trying to grasp the basics of spatial analysis or an advanced user exploring complex geoprocessing techniques, the community's documentation caters to diverse learning needs.
2. Interactive Forums and Discussion Boards:
QGIS's official forums and discussion boards provide an interactive space for users to seek help, share experiences, and exchange insights. Whether you're facing technical challenges, seeking advice on the best practices for a specific analysis, or looking for guidance on how to achieve a particular map layout, the community is quick to respond with solutions and suggestions.
3. User-Generated Plugins and Tools:
QGIS's plugin architecture allows users to develop and share their custom tools, extending the software's capabilities beyond its core features. The community has contributed an extensive collection of plugins that cater to specific spatial analysis needs. From advanced geoprocessing algorithms to specialized cartographic enhancements, these plugins reflect the diverse expertise of the community.
4. Collaborative Development:
The open-source nature of QGIS encourages developers to contribute to its codebase, enhancing its features and addressing bugs. The community-driven development ensures that QGIS evolves to meet the evolving needs of its users. New features, improvements, and bug fixes are often driven by user feedback and real-world requirements.
5. Workshops and Training:
The QGIS community frequently organizes workshops, webinars, and training sessions. These events offer opportunities to learn from experienced users and experts, gaining insights into advanced techniques, innovative workflows, and practical applications of QGIS in various domains.
6. Accessibility and Inclusivity:
The QGIS community is known for its inclusivity, welcoming users from all backgrounds and experiences. This diverse environment fosters collaboration and knowledge-sharing, helping users overcome challenges and discover new ways to leverage spatial data effectively.
7. Continuous Learning and Growth:
QGIS's community support ensures that users have access to a continuous learning experience. As the GIS field evolves with new methodologies, technologies, and data sources, the community keeps pace by sharing the latest developments and best practices.
8. Contributing to the Ecosystem:
Engaging with the QGIS community isn't just about receiving support; it's also about giving back. Users who acquire expertise often become contributors themselves, helping newcomers, developing plugins, or participating in documentation efforts. This virtuous cycle of knowledge exchange sustains the ecosystem's vitality.
Conclusion
Multi-criteria overlay Analysis with QGIS has transformed the way decisions are made in fields reliant on geographic data. By enabling the integration of multiple factors and criteria, QGIS empowers decision-makers to arrive at more comprehensive and informed conclusions. As this open-source GIS software continues to evolve, it holds the potential to revolutionize how spatial analysis is conducted across industries, promoting smarter, data-driven choices that account for the intricate interplay of geographical elements.
comments
Very informative
Hey there, Get ahead of the competition with AI Go to https://rokl.ink/increased-sales to uncover a lucrative partnership opportunity that will skyrocket your leads and sales. Best regards, Thomas Smith //Optout// If you wish to discontinue communication, please opt out at https://rokl.ink/optout.
Leave a Reply
Your email address will not be published. Required fields are marked *